Introduction
Welcome to the comprehensive guide designed for data scientists eager to master statistical testing and experimentation, specifically applied to soccer, real football 🙂 analytics. This article will guide you through a variety of statistical concepts and techniques, from basic hypothesis testing to complex multivariate analyses. By using real-world soccer data, we’ll explore how statistical insights can be applied to understand game dynamics, player performance, and strategic decisions.
1. Understanding the Basics
Data Understanding
To kick off our journey into soccer analytics, let’s begin by getting familiar with the type of data we’re dealing with. Soccer data is rich and multifaceted, comprising various metrics that capture the essence of the game. For this guide, imagine we have a dataset that records detailed match outcomes for professional soccer leagues. Each entry in this dataset corresponds to one match and includes the following key data points:
- Team Names: Home and away teams.
- Match Outcome: Win, loss, or draw for the home team.
- Fouls: Number of fouls committed by each team.
- Goals Scored: Goals scored by each team.
- Assists: Total assists by each team.
- Yellow and Red Cards: Number of yellow and red cards issued.
- Venue: Designation of the match as home or away for the teams.
This dataset provides a snapshot of what happened during each game, which allows us to conduct various statistical analyses to infer patterns, test theories about home advantage, player impact, and much more.
Disclaimer: This dataset is used to demonstrate statistical experimentation and testing. In real life, datasets such as Opta include a lot more features.
Setting Up the Python Environment
Before diving into the data, ensure that your Python environment is set up with the necessary tools for data manipulation and statistical analysis. Here’s how you can install and import the essential libraries:

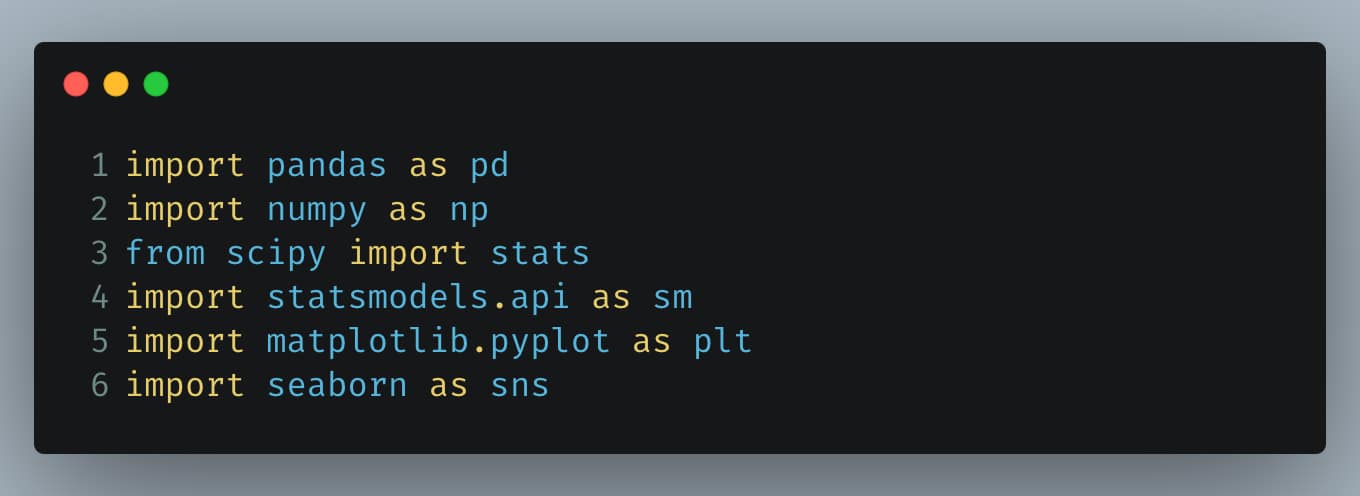
These libraries will help us load the data, perform statistical tests, visualize results, and much more. Now that we have our data and tools ready, let’s start with some basic hypothesis testing.
2. Hypothesis Testing and A/B Testing
Hypothesis Testing Basics
Hypothesis testing in statistics allows us to make inferences about a population based on sample data. In the context of our soccer data, suppose we want to test the common belief that “home teams win more often than away teams.” This claim can be tested using a hypothesis test.
Steps in Hypothesis Testing:
- State the Hypotheses
- Choose a Significance Level
- Calculate the Test Statistic
- Determine the Critical Value or P-Value
- Decision
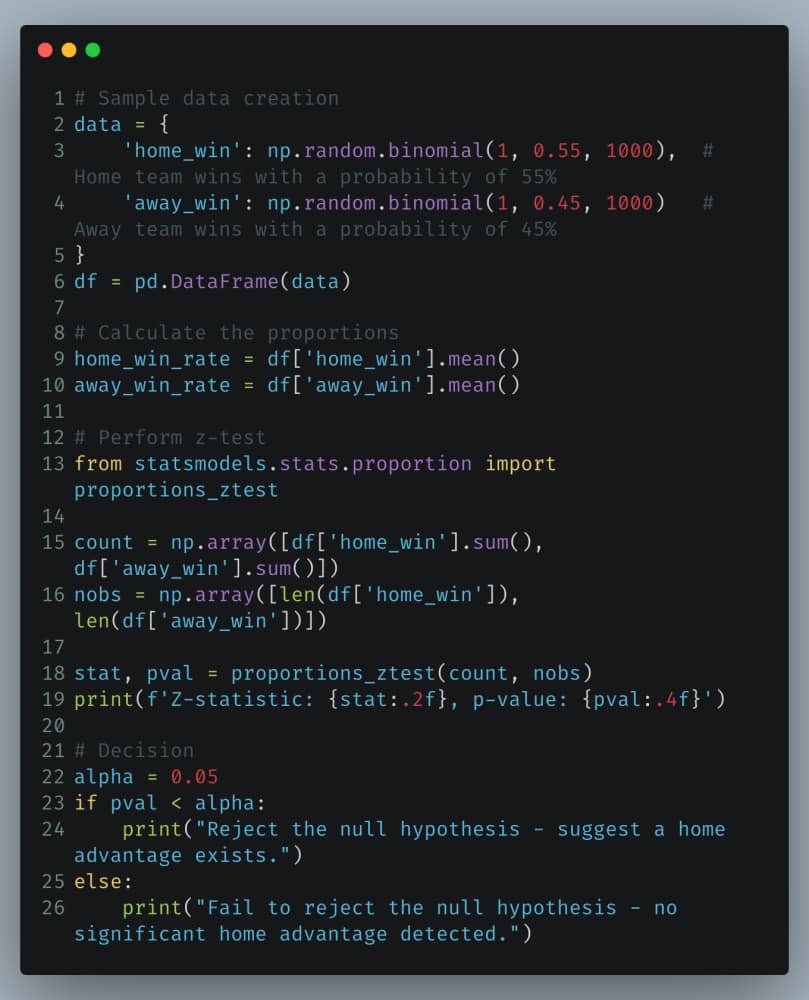
Python Implementation: Testing the Home Advantage
Here’s how we might test this hypothesis using Python:
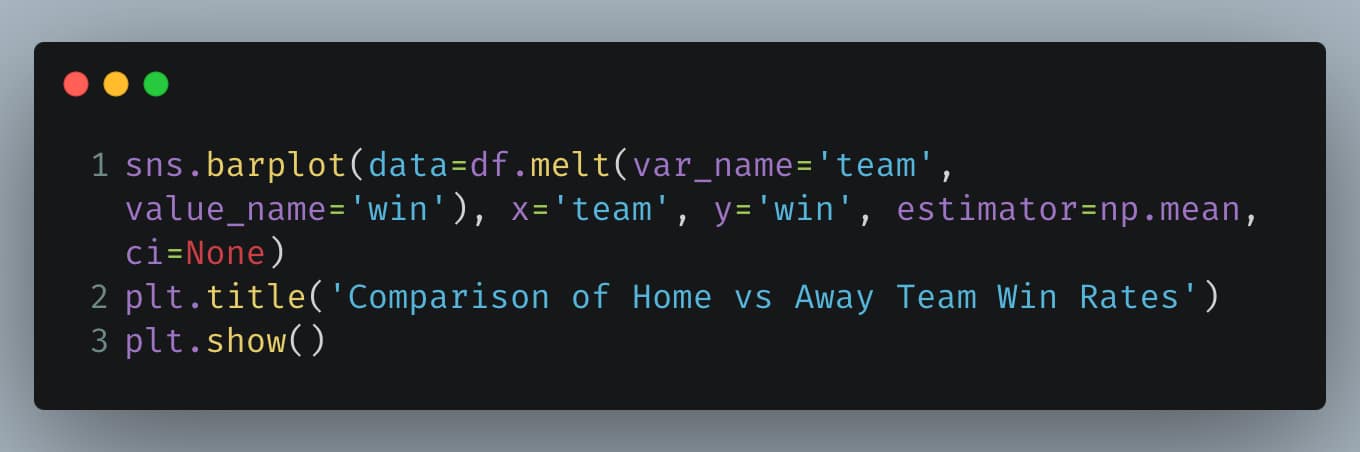
Comparing Win Rates
Visualizing the results can make the analysis more engaging. Let’s create a bar chart to compare the win rates:
A/B Testing in Soccer
A/B testing, or split testing, is a randomized experiment with two variants, A and B. It is widely used in digital marketing, product design, and other areas to compare two versions of a single variable. In soccer, imagine we want to test if a new training program (B) leads to more goals than the standard program (A).
Steps in A/B Testing:
- Define the Goal: Increase average goals scored per game.
- Create the Groups: Randomly assign teams to either the new training program (B) or the standard program (A).
- Collect the Data: Record the goals scored over the season.
- Statistical Analysis: Use a t-test to compare the mean goals scored by each group.
- Make Decisions Based on the Results: If the p-value is below the predetermined alpha level, conclude that the new training program is more effective.
We’ve laid the groundwork for understanding hypothesis testing and introduced A/B testing in a fun, soccer-related context. Are you ready to delve into more advanced topics like resampling and understanding p-values?
3. Resampling, Statistical Significance, and P-Values
Resampling Techniques
Resampling involves repeatedly drawing samples from a data set and calculating a statistic on each sample. This technique allows us to model the possible variations in our data without requiring strict assumptions about the population. In soccer, resampling can help us estimate the variability of match outcomes, like the number of goals scored, under different conditions.
Key Resampling Methods:
- Bootstrap: This involves taking repeated samples from the observed data with replacement. For instance, estimating the confidence interval for average goals scored per match.
- Permutation Tests: Used for hypothesis testing by rearranging the labels of the data points and recalculating the test statistic.
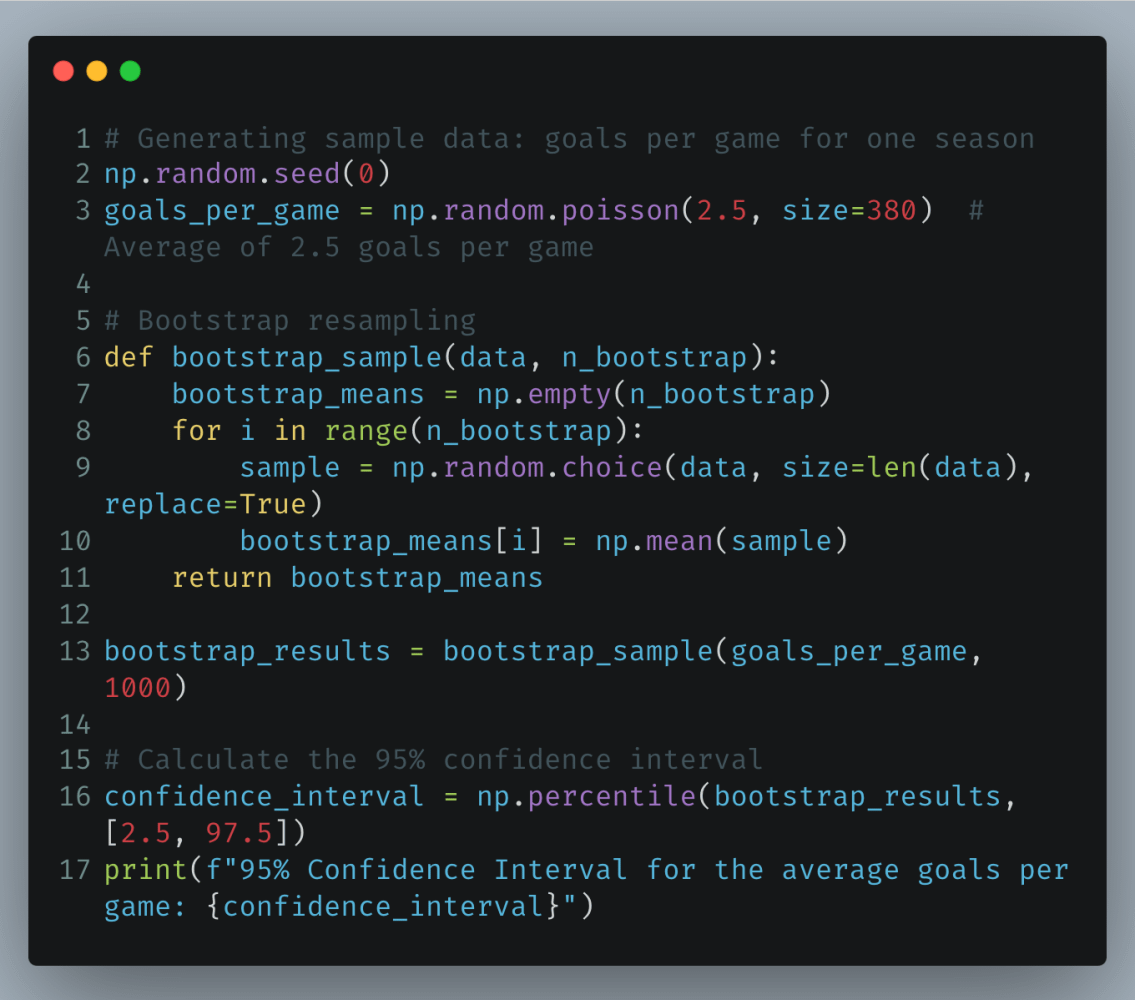
Python Example: Bootstrapping Goal Data
Suppose we want to estimate the confidence interval for the average goals per game in a soccer league.
Understanding Statistical Significance and P-Values
Statistical Significance: In the context of hypothesis testing, a result is statistically significant if the observed p-value is less than the chosen significance level (alpha), commonly set at 0.05. This indicates that the observed effect is unlikely to be due to chance.
P-Values: A p-value measures the probability of observing a test statistic at least as extreme as the one observed, under the assumption that the null hypothesis is true. In our soccer scenarios, a low p-value in comparing home vs. away win rates would suggest a real home field advantage.
P-Value Illustration
Creating a visualization that simulates the distribution of a test statistic under the null hypothesis can help intuitively explain p-values. Here’s how you could implement this in Python:
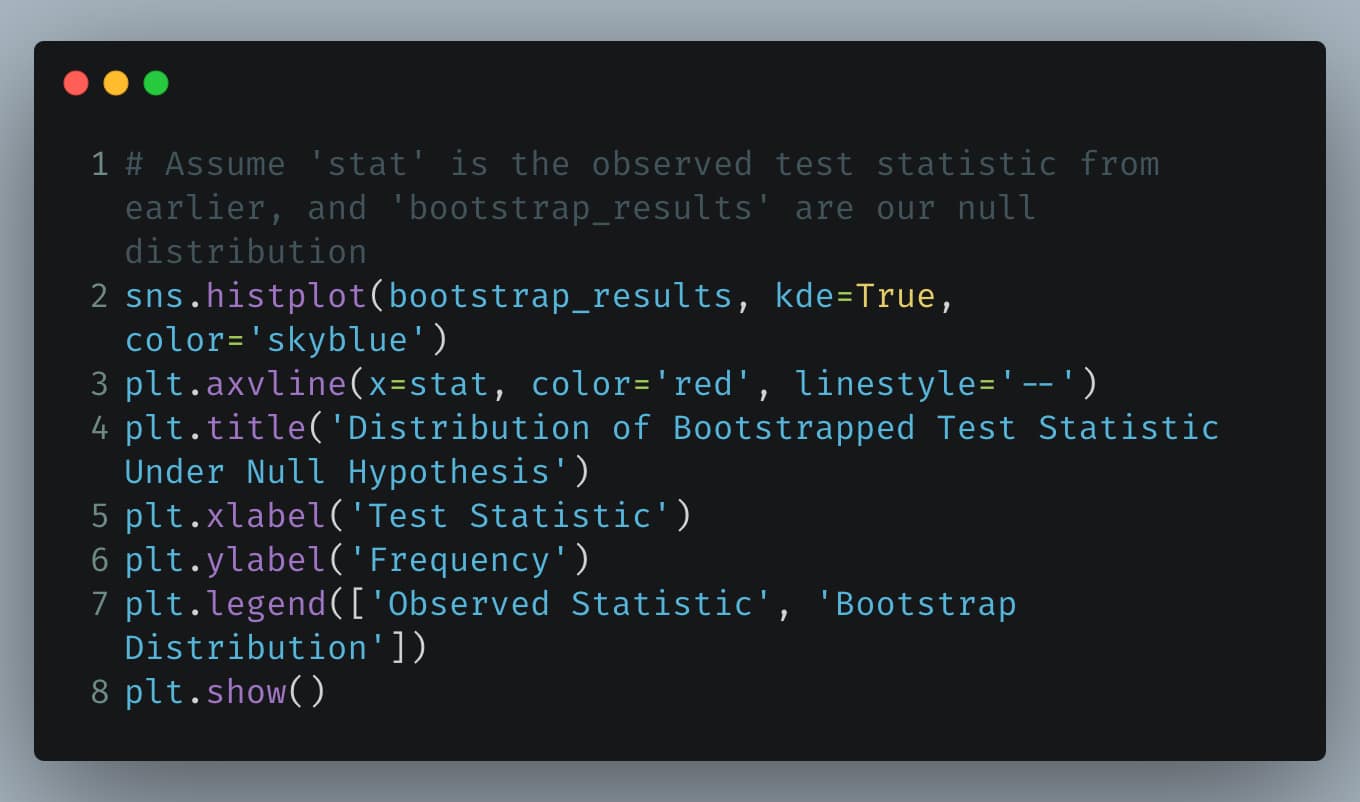
Resulted visualization can make it easier to see where the observed statistic falls relative to the distribution expected under the null hypothesis, thus clarifying the concept of a p-value.
Next, let’s advance into deeper statistical testing methods used in soccer analytics like t-Tests, ANOVA, and more . Are you ready to explore these methods and their applications?
4. t-Tests, ANOVA, and Chi-Square Test
t-Tests
A t-Test is used to determine if there are significant differences between the means of two groups, which may be related in certain features. In the context of soccer, a t-Test could compare the average goals scored by two different teams over a series of matches.
Python Example: Using t-Test to Compare Goals Scored
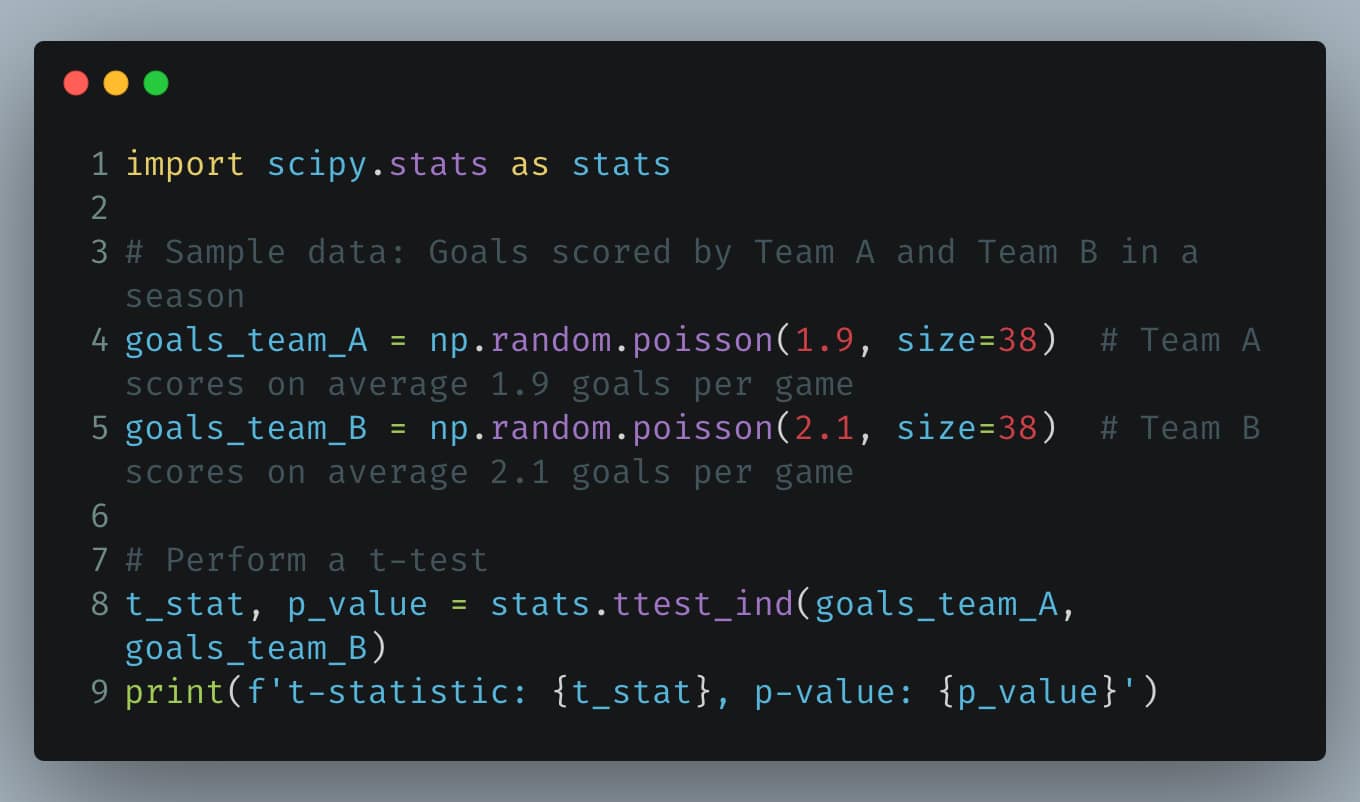
If the p-value is less than 0.05, we might conclude there is a statistically significant difference in the average goals scored by the two teams.
ANOVA (Analysis of Variance)
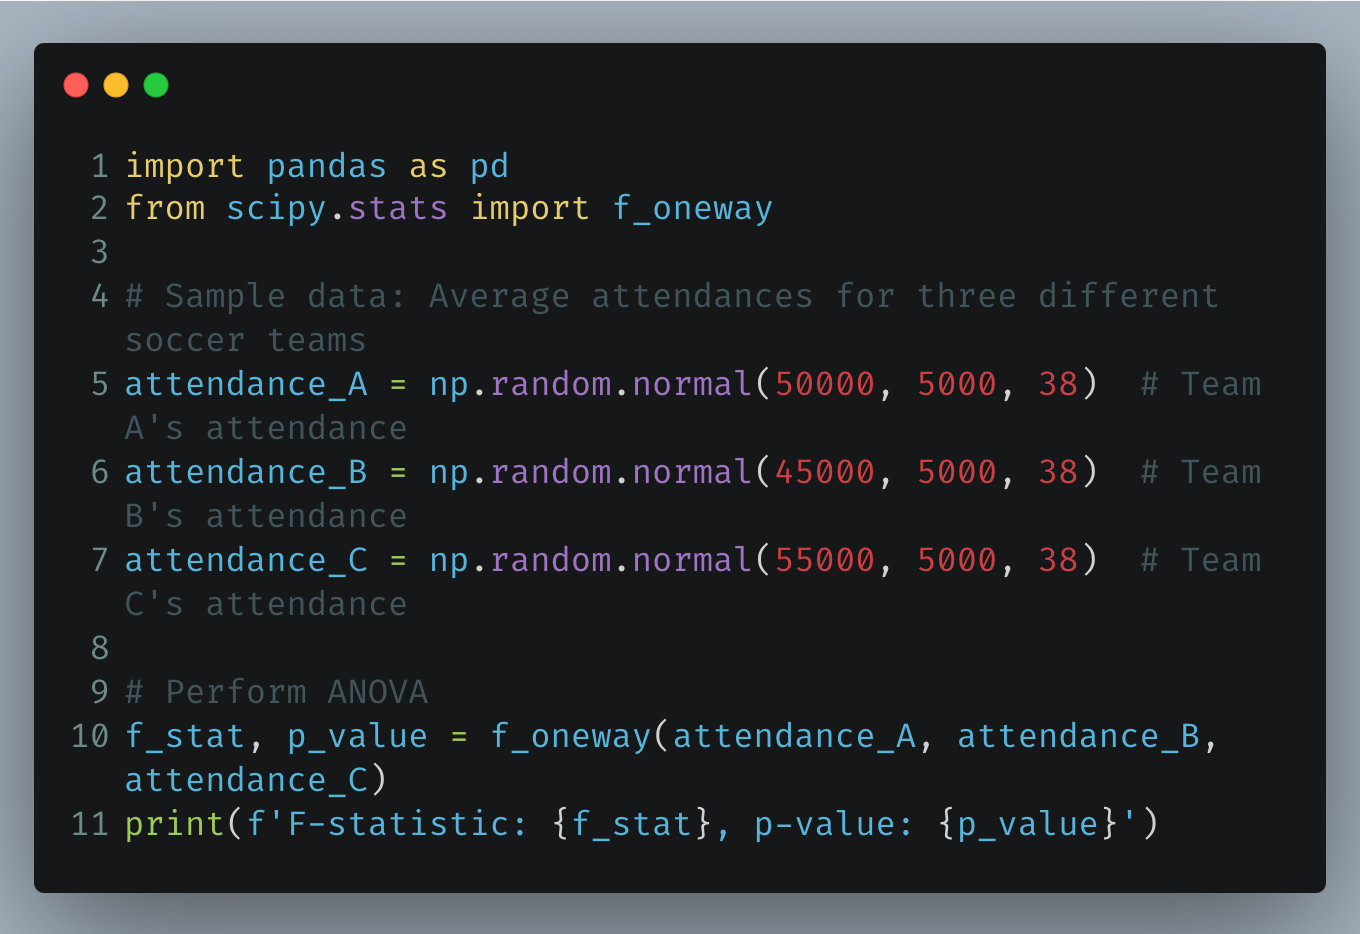
ANOVA is used to determine if there are any statistically significant differences between the means of three or more independent (unrelated) groups. For soccer, ANOVA could analyze if the average attendance differs significantly across multiple teams.
Python Example: ANOVA for Comparing Attendance
Chi-Square Test
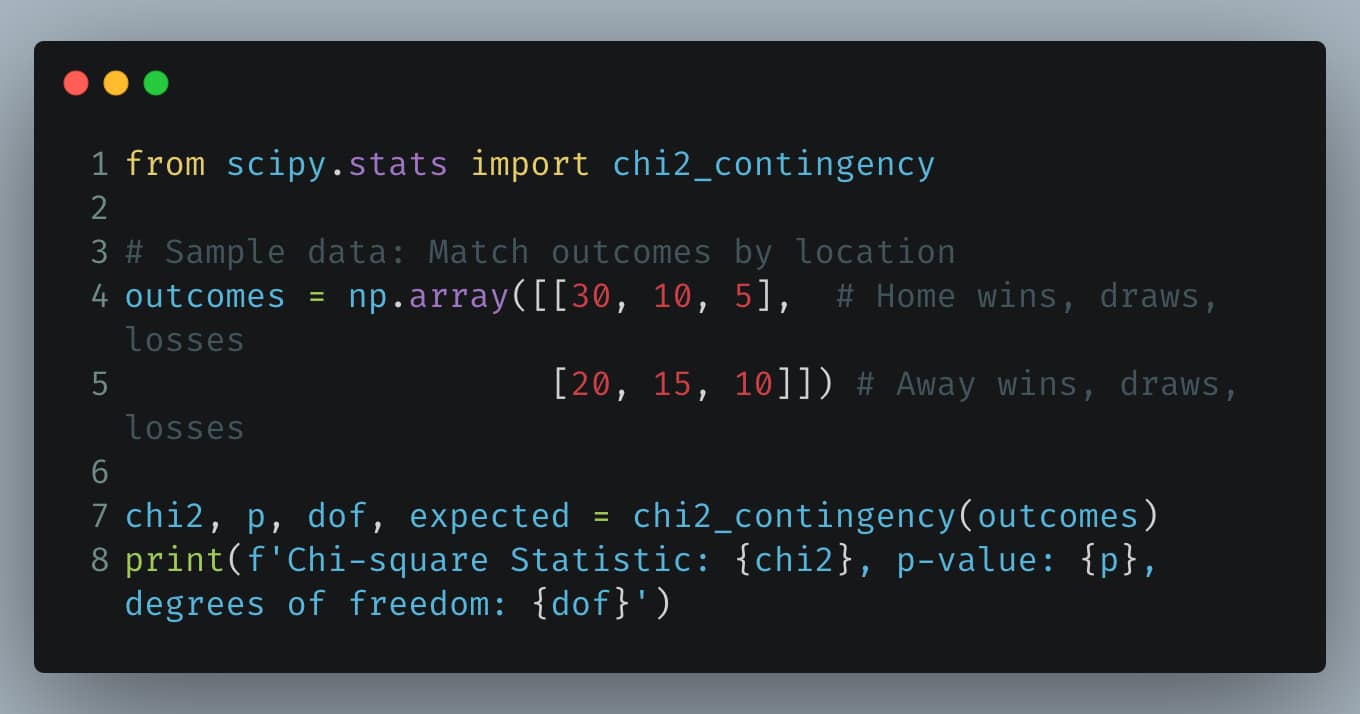
The Chi-Square test is used to determine whether there’s a significant association between two categorical variables. It’s used in soccer to check if the distribution of match outcomes (win, lose, draw) is independent of home vs. away games.
Python Example: Chi-Square Test for Match Outcomes
5. Multi-Arm Bandit Algorithm, Power and Sample Size
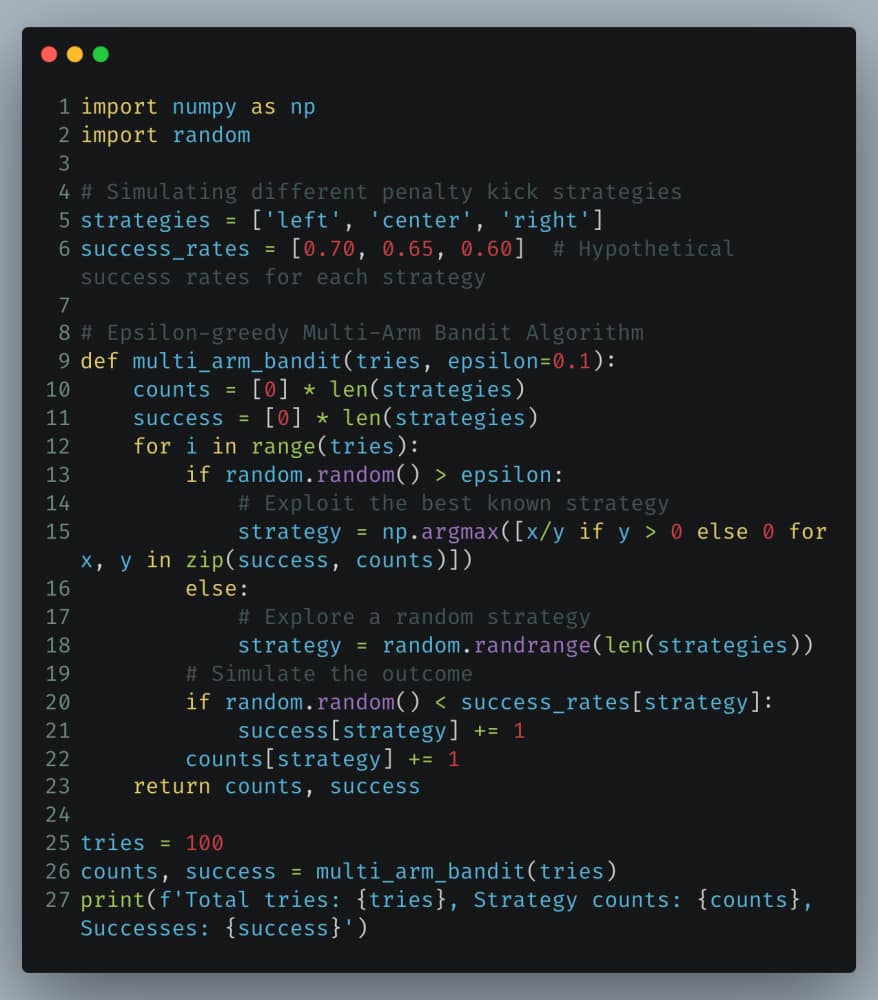
Multi-Arm Bandit Algorithm
In the context of soccer, the Multi-Arm Bandit Algorithm can be applied to optimize tactical decisions such as which players should take penalty kicks under different circumstances or which formation to use against specific opponents. The algorithm efficiently determines the best strategy by balancing the exploration of new tactics and the exploitation of known successful ones.
Python Example: Implementing a Multi-Arm Bandit for Penalty Kick Strategy
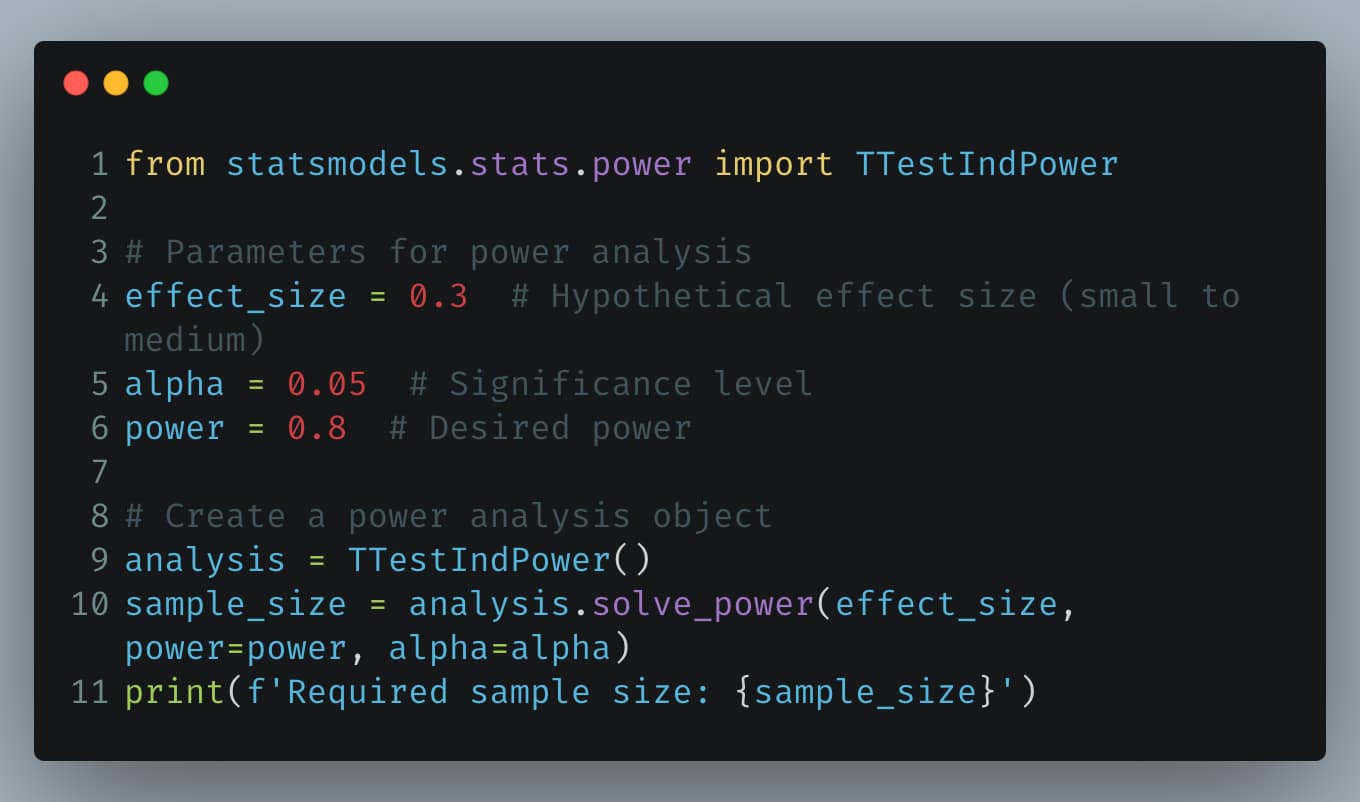
Power and Sample Size
Statistical power is the probability that a test will reject a false null hypothesis (i.e., correctly identify an effect when there is one). Power analysis is crucial in sports analytics to determine the minimum sample size needed to detect an effect reliably, such as the difference in player performance between home and away games.
Python Example: Calculating Power and Sample Size for Soccer Performance
These tools and methodologies provide data scientists with robust frameworks for making informed decisions based on statistical evidence. The application of these advanced statistical methods in soccer can significantly enhance strategic planning, player evaluation, and game management, leading to improved performance and competitive advantage.
As we continue to explore these advanced topics, it’s evident how statistical rigour and the right analytical toolkit can transform data into actionable insights in the high-stakes world of professional sports.
This concludes our detailed exploration of statistical testing and experimentation in soccer analytics. Through this comprehensive approach, we’ve covered a wide array of methods from the basics of hypothesis testing to the complexities of advanced statistical models, providing a solid foundation for any aspiring data scientist in the sports domain.
Thanks for reading this article!
FAQ
- What is statistical testing in soccer analytics? Statistical testing in soccer analytics involves using statistical methods to evaluate hypotheses about soccer data, such as player performance, team strategy effectiveness, and game dynamics.
- Why is hypothesis testing important in soccer? Hypothesis testing helps to make informed decisions based on data rather than assumptions, enhancing coaching strategies, player selection, and overall team performance.
- What is a t-test and how is it used in soccer analytics? A t-test is a statistical test used to compare the means of two groups. In soccer analytics, it can be used to compare the performance of two players, or the effectiveness of a strategy in different match conditions.
- How does ANOVA help in soccer data analysis? ANOVA (Analysis of Variance) allows comparison of more than two groups simultaneously. For example, it can assess the performance of a player across multiple games or seasons.
- What is the Chi-Square Test and its application in soccer? The Chi-Square test is used to determine if there is a significant association between two categorical variables. It’s commonly applied in soccer to analyze tactics, such as the success rates of different playing styles against various opponents.
- What is the Multi-Arm Bandit Algorithm, and why use it in soccer analytics? The Multi-Arm Bandit Algorithm is a decision-making strategy that balances between exploring new tactics and exploiting known strategies. It’s used in soccer for real-time tactical adjustments during a match.
- What does ‘statistical significance’ mean in the context of soccer analytics? Statistical significance in soccer analytics indicates that the result of a test is likely not due to chance, thus providing a reliable basis for tactical or strategic decisions.
- How is resampling used in soccer analytics? Resampling methods, like bootstrapping, are used in soccer analytics to estimate the accuracy of sample statistics by drawing repeated samples from the original data. This aids in more robust decision-making.
- Why are degrees of freedom important in soccer statistical tests? Degrees of freedom refer to the number of values in a study that are free to vary. They are crucial in determining the critical value and the interpretation of results in soccer analytics, impacting the conclusions drawn about team and player performance.
- What considerations should be taken for multiple testing in soccer analytics? Multiple testing involves conducting several statistical tests on the same data set. In soccer analytics, it’s important to adjust for this to avoid false positives, ensuring that the statistical conclusions about player and team performance are valid.